
Distracted Driving Accident Statistics: 2026 National Safety and Crash Data
According to safety research, drivers with high mobile phone engagement are 240% more likely to crash, yet the full scope of road danger often remains hidden across fragmented public reports. In 2024 alone, federal data recorded 3,208 fatalities and 315,167 injuries linked to inattention on American roads. Evaluating verified distracted driving accident statistics shows that driver distraction is not just a momentary glance away from traffic, but a severe cognitive impairment that makes objective evidence decisive in post-crash claims.
If you are piecing together what happened after a collision, sorting through complex government registries while managing physical recovery is frustrating. You already know that modern in-vehicle touchscreens and hands-free systems can be just as hazardous as handheld texting, but proving another motorist wasn't paying attention feels daunting. This guide delivers verified national crash benchmarks, explains how visual and cognitive distractions compromise reaction times, and details the electronic documentation that establishes liability after an accident. Here is what the latest national crash data reveals about driver safety and your legal options.
Key Takeaways
-
Review official distracted driving accident statistics to understand national crash trends and the proportion of fatal collisions tied to driver inattention.
-
Distinguish between visual, manual, and cognitive impairments to evaluate how activities like hands-free communication still compromise driver safety.
-
Identify high-risk motorist age groups and habitual multitasking behaviors that frequently lead to preventable collisions.
-
Discover the critical electronic and scene documentation, such as mobile device records and telematics data, required to establish fault.
-
Understand the fundamental steps for organizing medical records and property damage documentation when seeking an insurance recovery.
Table of Contents
-
National Distracted Driving Accident Statistics: Key Benchmarks and Fatalities
-
The Three Types of Driver Distraction and Their Crash Risks
-
High-Risk Demographics and Common Distraction Behaviors
-
Proving Distraction in Motor Vehicle Collisions and Insurance Claims
-
Navigating Legal Recovery After a Distracted Driving Accident
National Distracted Driving Accident Statistics: Key Benchmarks and Fatalities
Documented distracted driving accident statistics highlight a persistent, preventable danger across the United States. Federal tracking shows that driver inattention contributes to 12% of all police-reported motor vehicle collisions. While modern vehicle engineering continues to improve crash survivability, the presence of digital distractions keeps roadway fatality metrics stubbornly elevated across every state.
Annual Fatality Metrics and Long-Term Trends
Official records from the National Highway Traffic Safety Administration confirm that 3,208 individuals lost their lives in distraction-affected crashes during 2024. This tally represented roughly 8% of all roadway deaths nationwide, with 437 specific fatalities tied directly to confirmed cellphone operation. The trajectory of severe wrecks shifted dramatically over the past two decades alongside rapid smartphone adoption. The regular habit of texting while driving transformed brief driver glances into prolonged visual detachment from traffic conditions.
Federal safety officials acknowledge that standard police reporting frequently understates these totals. Because motorists rarely admit to phone usage following a severe collision, and crash reconstructionists cannot always access real-time device logs immediately, federal analysts estimate that true distraction-related deaths could reach as high as 10,000 per year.
Nonfatal Injury Estimates and Societal Costs
Beyond fatal outcomes, driver inattention produces extensive trauma and physical disability every day. Distracted driving accounts for roughly 13% of all injury crashes nationally, leading to substantial societal disruptions:
-
Emergency department treatment: An estimated 315,167 people sustained injuries in distraction-related motor vehicle incidents during 2024 alone.
-
Direct financial burdens: Research estimates direct annual crash costs exceed $98 billion, encompassing emergency services, medical interventions, and extensive property destruction.
-
Prolonged recovery challenges: Surviving victims frequently face catastrophic spinal, orthopedic, or head injuries that require long-term vocational retraining, rehabilitation care, and permanent lifestyle adjustments.
These figures underscore the devastating aftermath of momentary inattention. Examining comprehensive distracted driving accident statistics provides crash victims and their families with the context needed to understand roadway liability and pursue appropriate insurance remedies.
The Three Types of Driver Distraction and Their Crash Risks
Driver inattention extends far beyond holding a smartphone. Traffic safety experts analyze motorist behavior by evaluating three distinct operational impairments: visual, manual, and cognitive. While any single diversion increases collision vulnerability, activities that combine multiple categories present an extreme danger to everyone sharing the road.
Visual, Manual, and Cognitive Distractions Explained
Official guidelines from the National Highway Traffic Safety Administration classify driver distraction into three primary mechanisms:
-
Visual distractions: Taking your eyes off the highway. Looking down for just five seconds at 55 mph means traveling the entire length of a football field without watching the road.
-
Manual distractions: Removing one or both hands from the steering controls to adjust physical dials, consume food, or handle portable electronics.
-
Cognitive distractions: Letting mental focus drift away from driving tasks. This mental diversion triggers inattention blindness, where a motorist looks directly ahead but fails to register pedestrians, brake lights, or lane shifts.
Digital Devices and In-Cabin Infotainment Systems
Modern vehicle engineering increasingly replaces physical buttons with expansive digital screens and layered software menus. Navigating climate systems, music playlists, or digital maps demands sustained visual attention and manual inputs. Many drivers also assume hands-free interfaces solve the problem, but voice-to-text systems don't eliminate danger. The mental effort required to dictate messages creates a lingering cognitive lag that slows reaction times during sudden roadway emergencies.
Texting remains uniquely destructive because it forces visual, manual, and cognitive detachment simultaneously. When drivers multitask behind the wheel, the risk of a severe impact multiplies. Comprehensive distracted driving accident statistics consistently show that split-second diversions cause permanent harm. If you suffered injuries caused by an inattentive motorist, you can request a free case evaluation to discover how digital documentation helps prove fault in a claim.
High-Risk Demographics and Common Distraction Behaviors
While distraction threatens every commuter, roadway telemetry shows that dangerous behaviors cluster heavily within specific age cohorts and industry sectors. Recognizing which motorists are most prone to digital detachment helps crash victims understand how negligence unfolds during a collision. Comprehensive distracted driving accident statistics highlight stark generational patterns alongside emerging occupational hazards on national highways.
Age-Based Crash Patterns and Behavioral Tendencies
Inattention hazards vary widely by driver age. According to the NHTSA Distracted Driving Statistics publication, motorists aged 15 to 20 represent the largest proportion of drivers distracted during fatal wrecks. Novice operators lack developed road intuition, meaning unexpected obstacles overwhelm their cognitive bandwidth faster when a device chimes. In contrast, drivers aged 25 to 34 log the highest percentage of active phone usage during fatal impacts, frequently driven by workplace demands and habitual digital multitasking.
Vulnerable road users bear the physical brunt of these habits. When motorists shift attention away from traffic lanes, pedestrians, runners, and cyclists lack the structural protection of a vehicle frame. As a result, split-second inattention frequently produces devastating, life-altering impacts for individuals crossing intersections or using designated bike lanes.
Commercial Fleets and Delivery Driver Pressures
Occupational road use introduces intense operational strain. Last-mile couriers, rideshare contractors, and freight haulers must constantly interact with dynamic routing displays, dispatch alerts, and customer messaging platforms while actively operating large vehicles. This digital workload elevates roadway risks across multiple sectors:
-
Strict federal safety mandates: Federal Motor Carrier Safety Administration rules strictly prohibit interstate commercial truck and bus operators from using handheld mobile devices while operating a vehicle.
-
Dispatch software interference: Continuous algorithmic prompts and delivery arrival countdowns pressure couriers to monitor handheld screens rather than watching surrounding traffic flow.
-
Corporate vicarious liability: When commercial logistics employers demand immediate driver responsiveness or enforce unrealistic route schedules, the company itself may share direct civil liability for distraction-related collisions.
Identifying these systemic pressures is essential for post-crash investigations. National distracted driving accident statistics demonstrate that severe crashes stem from both individual operator choices and corporate policies that encourage digital engagement behind the wheel.
Proving Distraction in Motor Vehicle Collisions and Insurance Claims
While distracted driving accident statistics clearly reveal national danger patterns, proving inattention in an individual insurance claim requires concrete proof. At-fault motorists rarely confess to checking a screen prior to an impact. Insurance adjusters regularly dispute claims by attributing wrecks to unpredictable road hazards or phantom vehicle cutoffs. Overcoming these defenses demands a systematic approach to collecting perishable evidence before it disappears.
Crucial Evidence for Establishing Driver Inattention
Physical and visual records from the scene provide immediate insight into driver behavior before impact:
-
Surveillance and dashcam files: Traffic cameras, exterior security systems from nearby businesses, and dashboard cameras capture vehicle drift or lack of brake light illumination.
-
Eyewitness depositions: Neutral bystanders, cyclists, or adjacent motorists can confirm seeing a driver looking down, holding a smartphone, or reacting with delay.
-
Official collision documentation: Responding officers document vehicle trajectory, cite traffic violations, and record spontaneous admissions made directly after the wreck.
-
Scene skid measurements: Accident reconstructionists inspect the roadway. A complete absence of pre-impact skid marks indicates that the motorist struck another vehicle without ever braking.
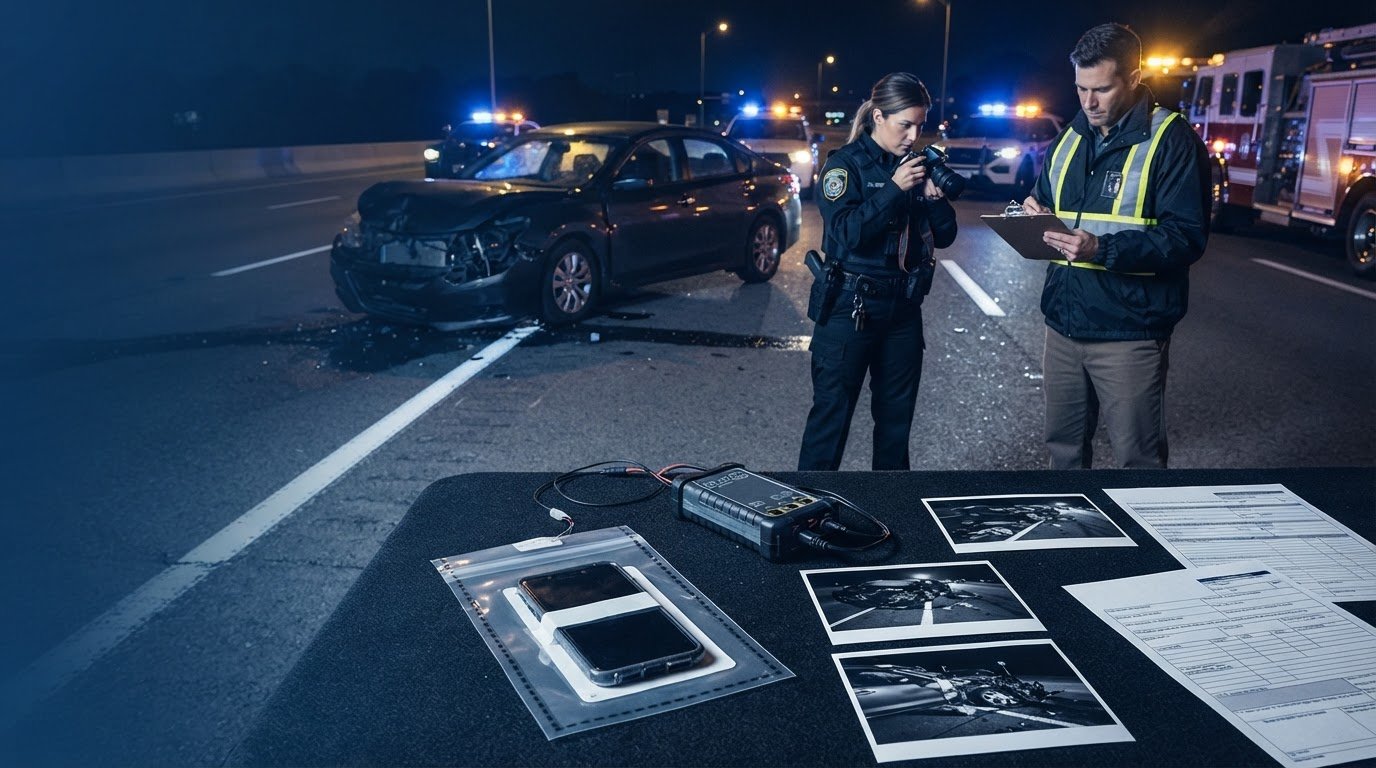
Subpoenaing Digital Data and Event Data Recorders
Digital records deliver indisputable timelines that connect physical driving errors with secondary device activity. Cellular carriers routinely track timestamps for voice calls, text transmissions, and streaming data. Because telecommunications providers purge detailed user logs within weeks, formal legal preservation letters must be issued quickly to prevent destruction of this information.